 MacLenz
Mac performance
Why does my Mac hang? Now you can see.
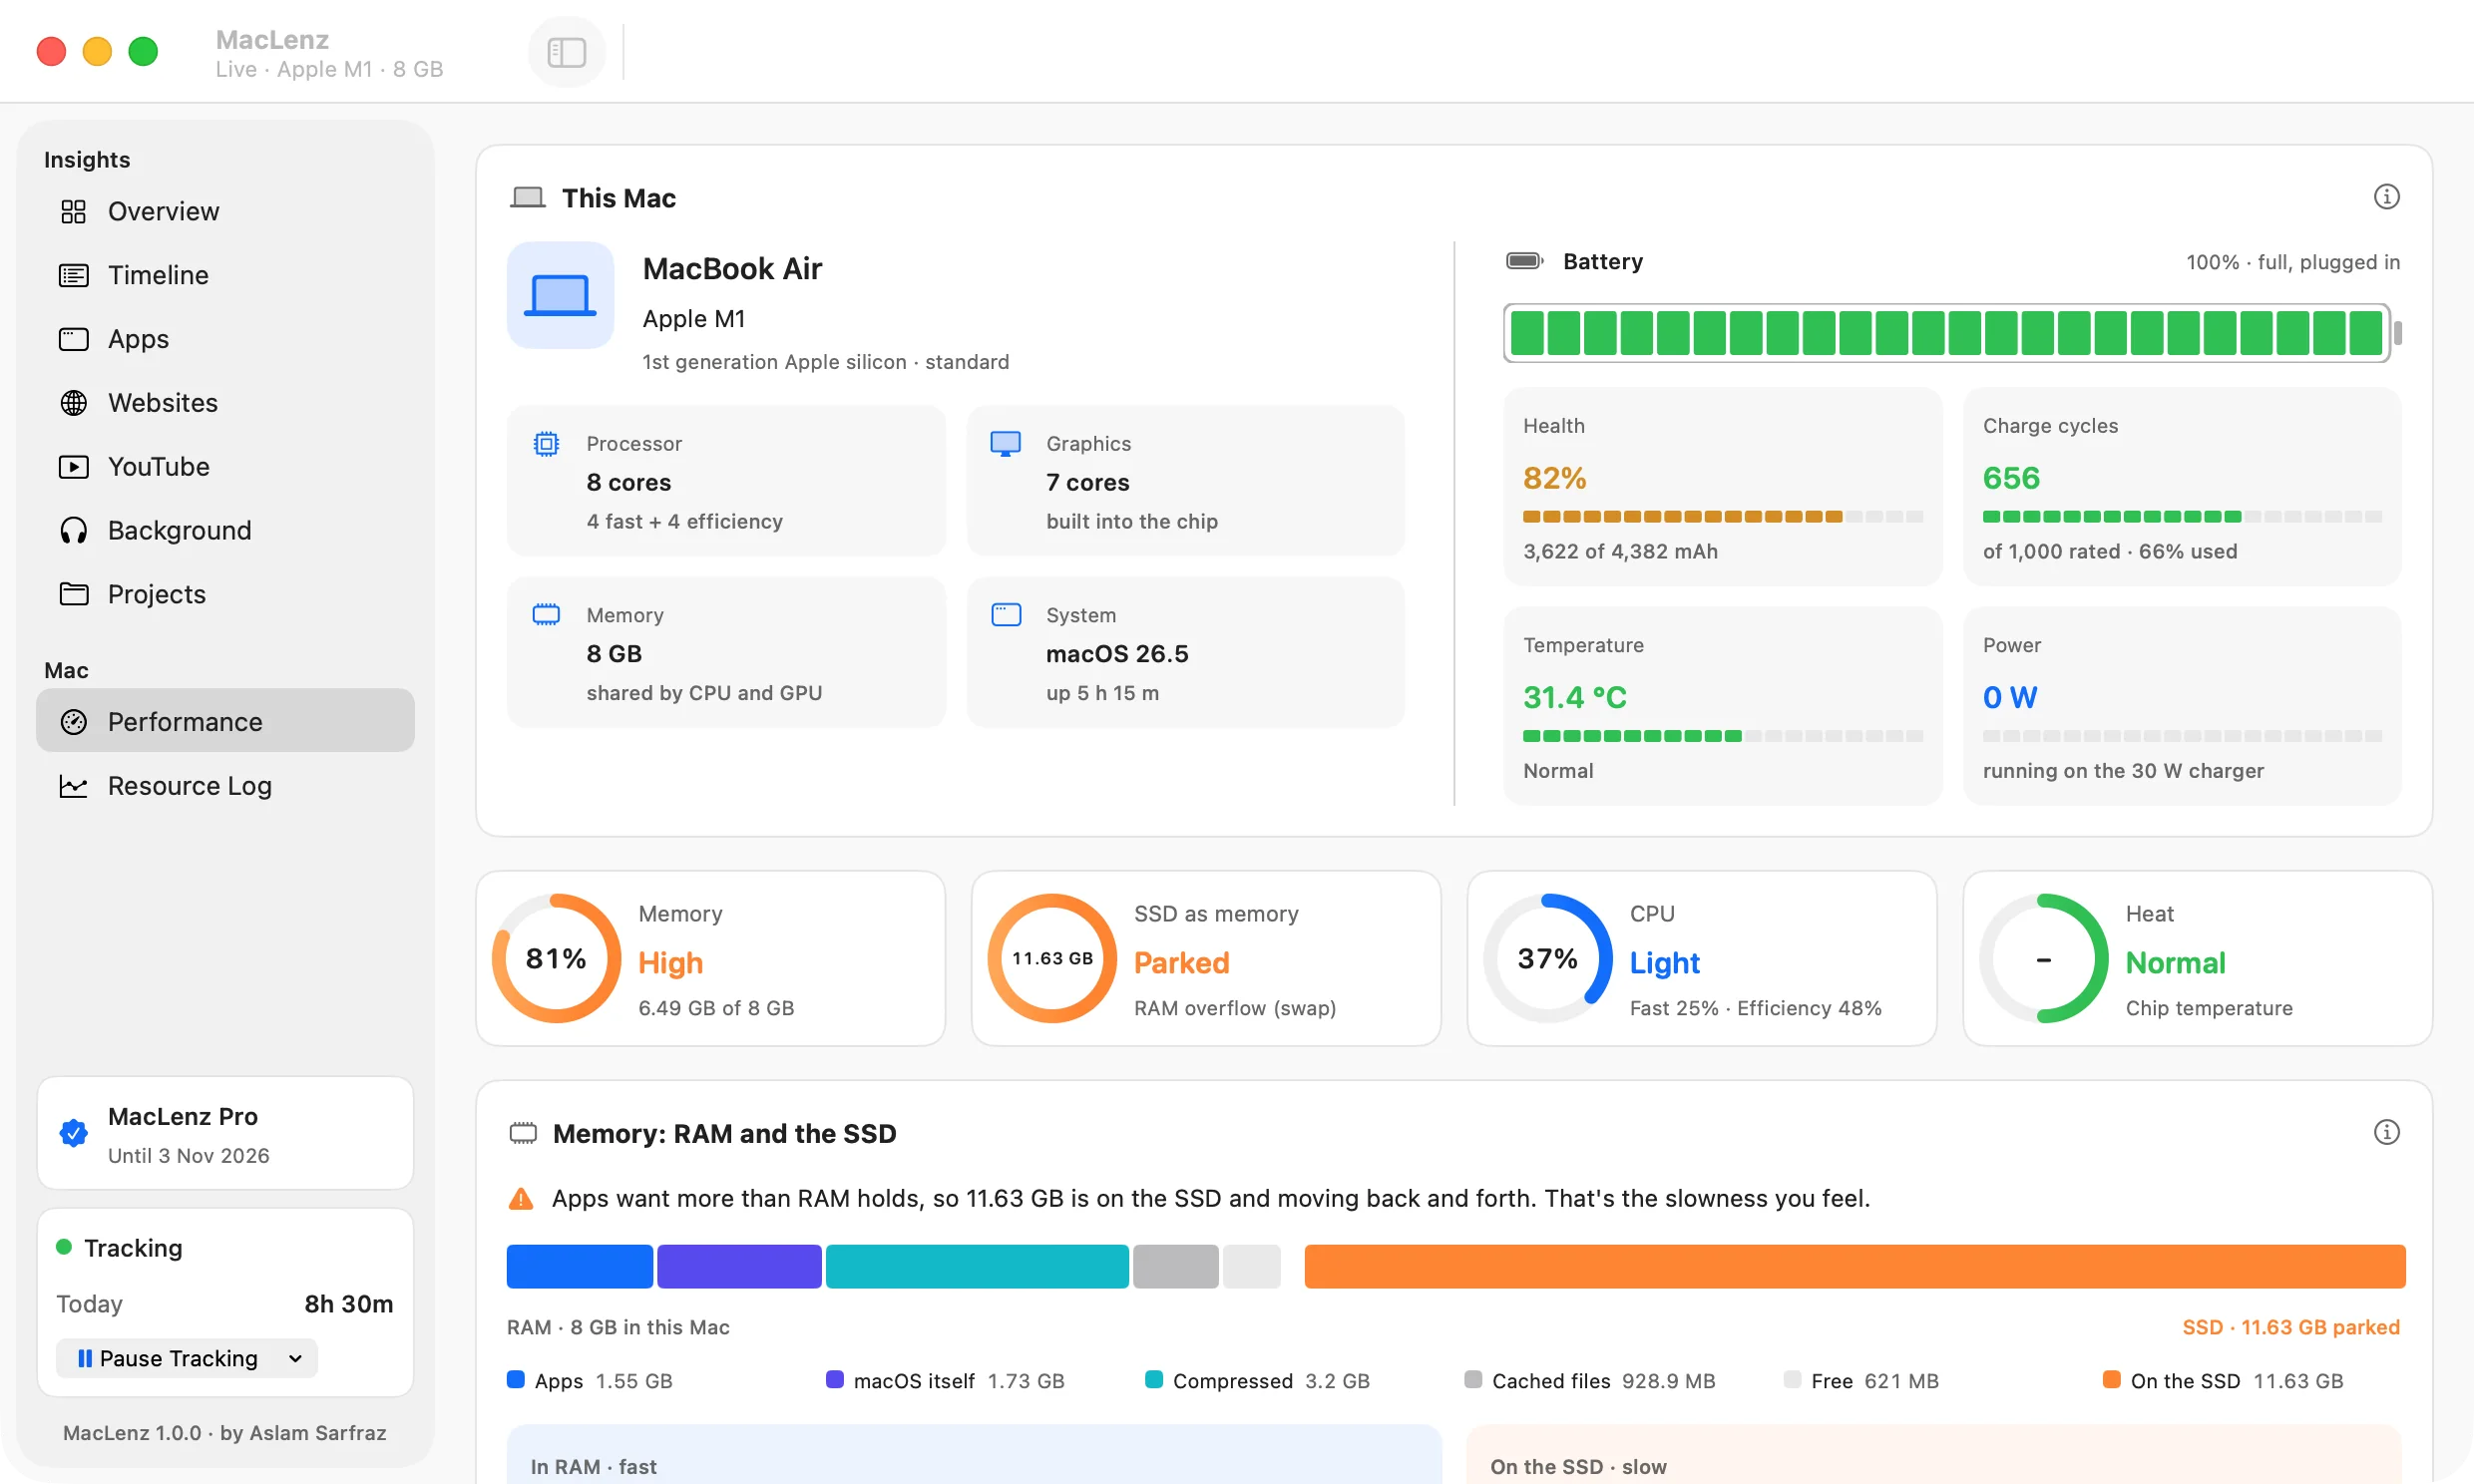
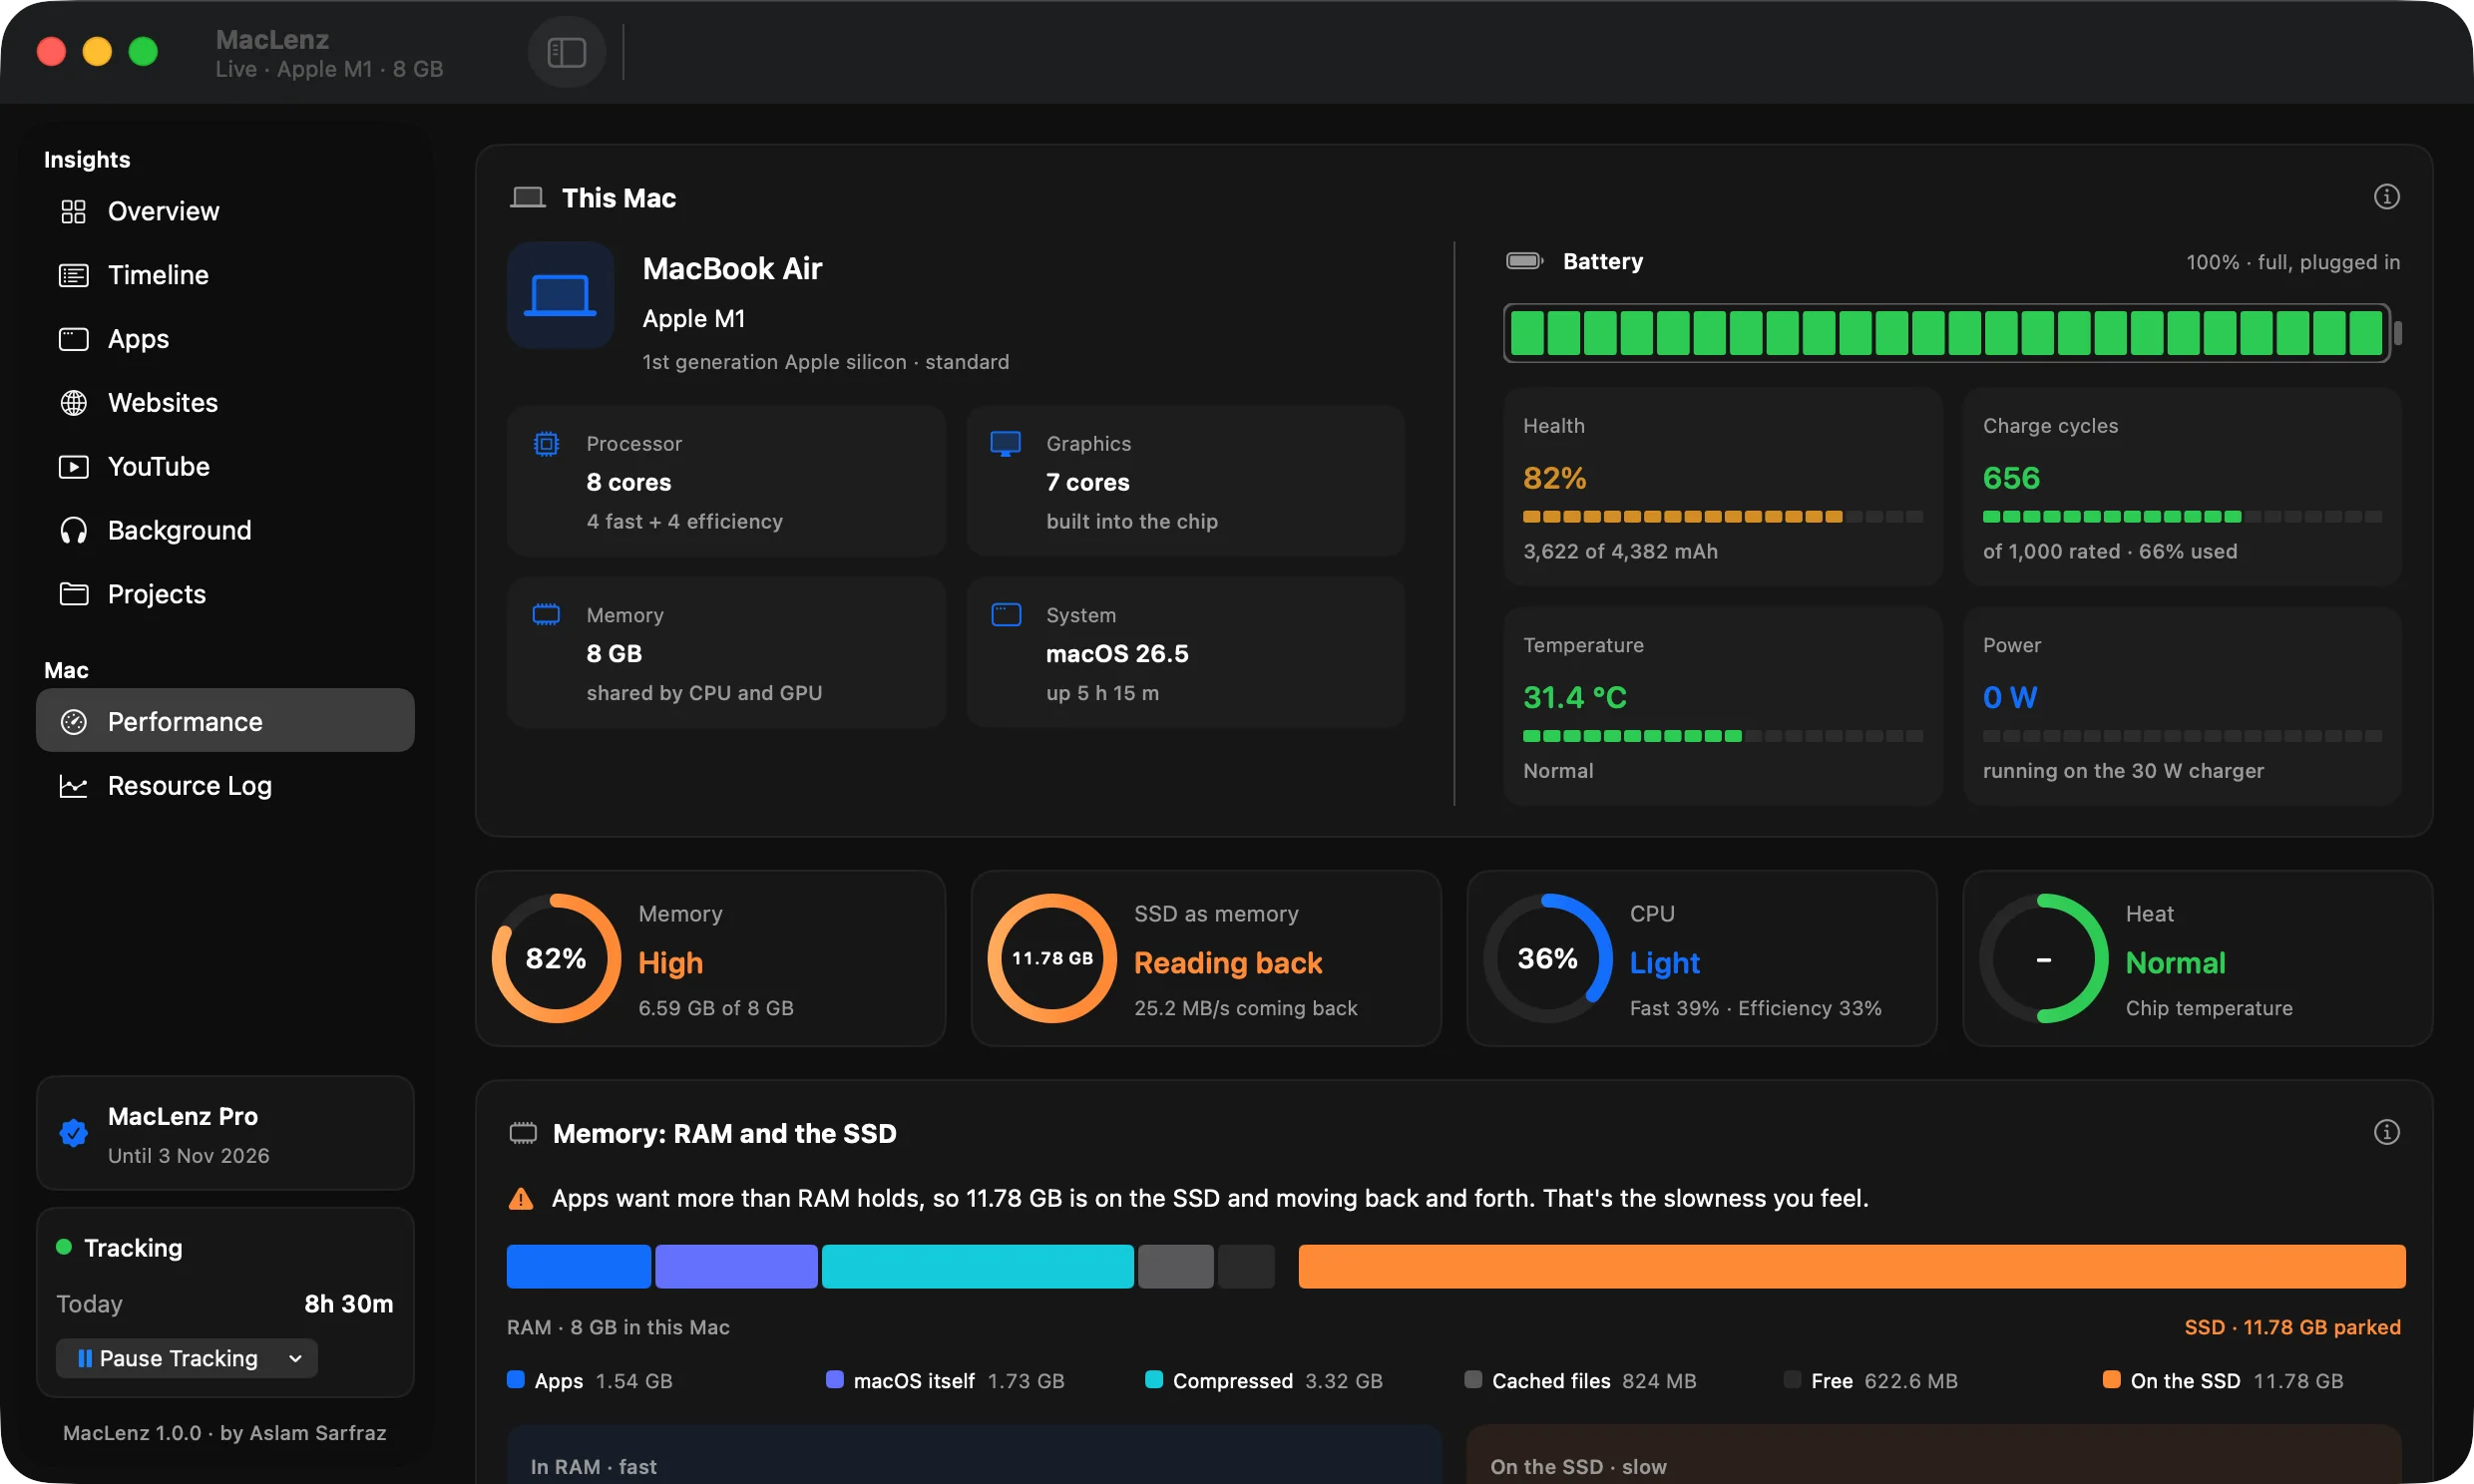
MacLenz shows how much RAM you are using, how much of it has spilled onto the SSD, how hard the processor is working, how warm the chip is and how your battery is aging. It says all of it in plain words.
RAM and the SSD
The desk and the storage room
RAM is your desk. The SSD is a storage room down the hall. While everything you are working on fits on the desk, apps answer at once. When the desk is full, macOS moves some of it to the storage room, and every time you switch back to one of those apps the Mac has to fetch it again. That wait is the hang you feel.
MacLenz draws both sides live. You see how much is in RAM, how much is parked on the SSD (macOS calls it swap), how much is coming back, and how fast data moves through each. A one-click speed test measures your SSD so you can compare it with RAM.
- How much is on the desk and how much is parked on the SSD
- Which apps hold the most memory
- Memory pressure, in the word macOS uses: Normal, Warning or Critical
Four gauges
Memory, SSD, CPU and heat at a glance
Memory
How full the RAM is, with macOS's own pressure word beside it. Normal means your apps fit.
SSD as memory
How much RAM overflow sits on the SSD, and whether apps are reading it back. Reading back is what makes a Mac feel slow.
CPU
How hard the processor is working, split between the fast cores and the efficiency cores on Apple silicon.
Heat
The chip's temperature and whether macOS is slowing the Mac down to cool off.
This Mac and its battery
Know your Mac and your battery's health
The top of the page says which Mac this is: the model, the chip and its generation, the number of CPU and GPU cores, the memory, the macOS version and how long it has been up.
Beside it sits the battery. MacLenz shows its health as the maximum capacity compared with when it was new, the charge cycles used out of the number the battery is rated for, its temperature, and the watts flowing into or out of it right now. These are the same figures System Settings reports for capacity and cycles, with the temperature and live power added.
If you wonder how to treat the battery, the article on keeping a Mac plugged in or running it down explains what Apple and the research say.
Every CPU core and the GPU PRO
Pro adds a view called Inside the chip. Every CPU core gets its own box of pixels that fills with load, with a streak of the last minute beside it, and the GPU is drawn the same way. You can see whether the work is shared, whether one core is carrying everything, and which cores are idle.
Resource log
Look back at any slowdown
Performance pages show the present. The resource log keeps the past. It records when memory ran short and who was holding it, every moment the Mac stalled, how much CPU and memory each app used, and what the optimizer did. Readings are kept second by second, with nothing averaged away.
An events list marks apps opening and closing, sleep and wake, and when you went idle or away. The worst individual seconds are listed so you can find what caused them. When you want to share or analyse the log, it exports as CSV, JSON or a readable report, which you can hand to an AI assistant for a second opinion.
The Free plan keeps the last 3 days of the log. Pro keeps it as long as you choose.
Menu bar
The second menu bar item opens a system panel with CPU, memory, heat, storage and battery, the top apps by memory, CPU or battery, and buttons for Activity Monitor and the full Performance page.
Questions
Questions about Mac performance
What is memory pressure?
It is macOS's own measure of how hard memory is working, shown as Normal, Warning or Critical. Normal means your apps fit in RAM.
Is it bad if my Mac uses the SSD as memory?
Some use is normal. What slows a Mac down is reading that memory back from the SSD, which MacLenz shows as Reading back. Parked means the overflow is there but nothing is being fetched.
Does it replace Activity Monitor?
No. Activity Monitor is still there, and the menu bar panel has a button that opens it. MacLenz adds history, plain-language explanations and a log of every slowdown.
Why is my battery health below 100%?
Batteries wear with use and time. Apple designs recent Mac laptop batteries to keep up to 80% of their capacity at 1,000 charge cycles. The article on plugging in or running down your Mac explains what affects the wear.
Be the first to know when MacLenz launches
Leave your email and we will write to you once, the day it is ready. The Free plan has no time limit and needs no card.
Download for Mac